Click here to see a complete sample result.
 |
Type - lists how many adjacent pairs appear in a number combination.
For example, 01 02 15 26 35 46 is of type 1 because there is 1 pair of adjacent
pairs 01/02 appears in the combination.
01 02 13 14 15 38 is of type 3 because there are 3 pairs of adjacent pairs
01/02, 13/14, 14/15 appears in the combination.
01 03 15 26 35 46 is of type 0 because there are no adjacent pairs appears
in the combination.
An m/n lottery has at most m-1 adjacent pairs in one combination. For example, a 6/49
lottery has at most 5 adjacent pairs if each number of the combination is adjacent to
the next one.
For example, 01 02 03 04 05 06 has 5 pairs of adjacent pairs: 01/02, 02/03, 03/04, 04/05, 05/06.
For an m/n+1/p lottery, for example, multi-state Powerball (5/49+1/42) and Big Game
(5/50+1/36), the number on the last digit is not included in Adjacent Pairs
Analysis because it is drawn separately. For example, a Powerball winning combination
01 02 15 26 41 42 is of type 1 because the number 42 on the last digit (the "Powerball")
is drawn independentently from the first five digits although 41/42 looks also like
an adjacent pair.
|
 |
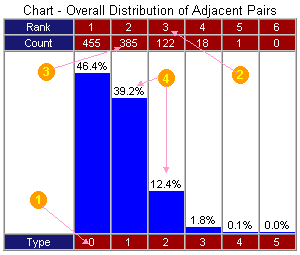
Rank - orders the adjacent pair types according to how many winning combinations belong
to the corresponding types in the selected time period.
For example, in the above chart, there are 455 winning combinations of type 0 and
rank 1. There are 385 winning combinations of type 1, rank 2.
|
 |
Count - indicates how many winning combinations are of the adjacent pair type
in the selected time period.
For example, there are 122 winning combinations of type 2.
|
 |
Percentage - indicates what percentage the winning combinations belong to
an adjacent pair types account for the total draws in the selected time period.
For example, there are 455 combinations of type 0 (which means there is no
adjacent pair in the winning combinations). Type 0 accounts for 46.4%23056763740f the total
981 (455+385+122+18+1+0=981) draws in the selected time period.
|
|
Adjacent Pairs Pattern Analysis gives you the probability that two consecutive numbers will win together in your lottery of choice.
The chances of two consecutive numbers winning together depend on two critical factors:
- Number field: The higher the range of numbers to be drawn in a lottery, the less possible it becomes for two
consecutive numbers to be drawn together. A lower number range increases the likelihood of consecutive numbers being drawn.
For example, about 80% of the draws of West Virginia Cash 25 (a 6/25 game) have at least one adjacent set of numbers,
while only 40% of the draws of Pennsylvania Super 6 Lotto (a 6/69 game) have at least one adjacent pair.
- Digits Drawn: The more digits drawn in a particular game, the more likely two consecutive numbers will win together.
For example, about 80% of the draws of Maryland Cash in Hand (7/31) have at least one adjacent pair, but only 55%
of the draws in Idaho Fast 5 (5/32) have consecutive numbers among the winners.
When you play your lottery, it is important that you ask yourself these questions:
- Should you include adjacent pairs in your combination?
- How many adjacent pairs should you select?
- What adjacent pairs should you play?
Use the Adjacent Pairs Pattern Analysis and Adjacent Pairs Hit Frequency and Rank Analysis to develop the answers to these questions.
Conducting an Adjacent Pairs Pattern Analysis based on the winning numbers over a long period will answer the first two
questions. The more draws you use in your analysis, the more accurate your results will be. With the results you gain, you should know
whether to play adjacent pairs and how many to play.
For example, based on an analysis of Arizona Lotto (6/42), 154 draws from January 3, 1998 to June 26, 1999 showed 54.5% having no
adjacent pairs. About 45.5% of the draws had one adjacent pair. So, if you play 10 combinations, you are likely to have three or four
combinations with one adjacent pair and, at most, one combination with two adjacent pairs since about 9.7% of the Arizona lottery had
two adjacent pairs. Definitely avoid using three adjacent pairs in any one of your combinations because that result happened in only 1.9%
of the Arizona draws. Using three or more adjacent pairs, according to the analysis, would make your chances of winning very slim.
After deciding how many adjacent pairs to play, you may use Adjacent Pairs Hit Frequency and Rank Analysis to decide which adjacent pairs to choose.
|